sigma
Sigma Trail
Sigma Trail is the component where you can view your application logs. In sigma, we have categorized logs into two types.
1. Test Logs [TEST]
Test logs are the type, that will be generated in realtime when you execute a test case within the IDE. These logs will include the result/response of the test execution and the generated logs in line.
2. Prod Logs [PROD]
Prod logs are the type, that will be generated when you invoke the lambda function through one of your event sources. (ie: Api Gateway, S3 event etc.) These logs does not include the result/response of the execution.
Log Request
We refer log request as the group of log lines which are generated during a one cycle of execution of lambda function.
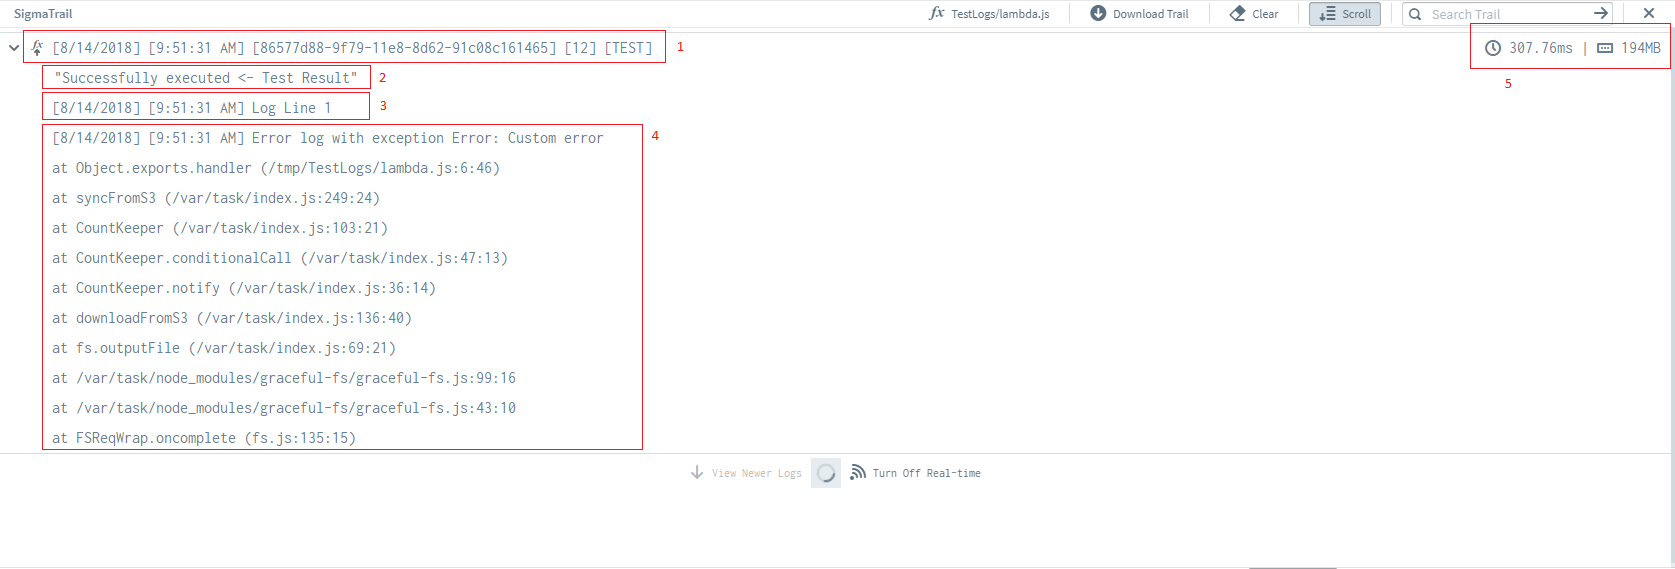
1. Log Request header
Log request header gives you a quick insight about the Log Request. The format of the header is as follows.
[Date] [Time] [Request Id] [No of log lines] [TEST / PROD]
You can click on Log request header to expand or collapse the log lines.
2. Test execution result
This section is only applicable for TEST logs. If the result can be parsed to a JSON, Sigma will show you the response in an expandable JSON tree.

3. Log line
Log line is a single line of a console log generated by lambda code
4. Stack Trace
Stack trace is a report of the active stack frames at the time of an error is thrown. This will be useful when debugging an application.
5. Resource Utilization
This section indicates the time taken to execute the function logic and the memory utilized to process the respective request.
Sigma Trail Controllers

Sigma trail header has following controls to fine tune your logs view.
1. Lambda Selector
Sigma Trail shows only trails related to one particular function within one screen. If you want to switch sigma trail to show trails of a different function, click on this button to get a list of available lambda functions.
In addition to this selector, switching between editor tabs will automtically switch Sigma Trail to show logs of the focused function.
2. Download Trail
Sigma allows you to download logs in following two formats.
- Text
- JSON
3. Clear Logs
If you are not interested about the visible logs, you can hide visible logs by this button.
4. Auto Scroll
Sigma automatically scrolls the trail for you. Whenever a new Log request is appended, trail will get automatically scrolled and expand the new log request. You may switch on/off this feature by toggling this button.
5. Search logs
You can filter Sigma trails by using Cloudwatch filter pattern and syntax.
This will give you an effect similar to tailing with grep.
6. Close
Close the sigma trail panel.
Resizing logs view
If you want to make more room for your code, you may resize sigma trail by holding and dragging the header as below.
Navigating over Old Log requests
Sigma by default shows you only the latest 15 log requests.
To view older logs, you may use following controllers.
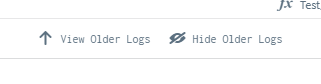
View Older Logs
This will load 15 more older logs to sigma trail.
Hide Older Logs
This button will take you back to the 15 latest logs only mode.
Controlling Sigma’s Log fetching behaviour
By default Sigma continuously polls for new logs from Cloudwatch. If you wish to control this behaviour, you may use following set of buttons.
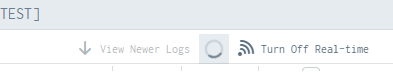
Tune On/Off Real-time logs
Turning of Real-time logs will stop Sigma from automatically polling for new logs.
View Older Logs
In non Real-time mode, use this button to request for newer log requests.
Additional Notes
Sigma is using Cloudwatch to generate the Sigma trail. Even though Test logs will appear immediately after execution, Production logs will take up to 30 seconds to appear in the Sigma Trail, due to the delay at Cloudwatch.